Testing
Lithium-ion batteries degrade as a result of usage or storage conditions, life cycle stresses,
and the stability of the constituents of the cell (e.g., electrode materials, electrolyte). The
degradation of a battery can be observed many different ways, both through non-destructive
and destructive measurements. Non-destructive measurements include electrical
characterization tests such as electrochemical impedance spectroscopy (EIS),
charge/discharge cycling, DC internal resistance (DCIR), open circuit voltage (OCV), and
cyclic voltammetry. Additionally, the internal structure of the battery can be probed through
ultrasonic transduction, neutron imaging, and X-ray microscopy. Destructive tests require
disassembling the cell and directly observing changes in the electrode morphology.
Non-destructive electrical testing
-
Charge/discharge cycling of the cell is used to characterize the full discharge capacity of
the cell in addition to assessing the overall characteristics of the batterys discharge
behavior. The battery should be charged and discharged at an appropriate rate based on
inputs from the data sheet and the required use conditions of the battery. Typically, the
battery is charged using a constant current/constant voltage (CCCV) routine and
is charged using a constant current (CC) discharge routine. This is repeated several times
to identify the rate of capacity fade/degradation. The figure below shows a standard
CCCV charge and CC discharge profile. A constant current is applied until the battery
reaches its upper voltage limit (usually 4.2 Volts for most lithium-ion batteries). Once the
battery reaches its upper voltage limit, the voltage is held constant and the current is free
to change. During this portion of the charge routine, lithium ions are inserted into the
anode, increasing the potential difference between the two electrodes. As more lithium
ions are inserted into the anode, the current required to maintain 4.2 Volts decreases. The
constant voltage portion of the charge profile is usually terminated either by a time or
current threshold. The time is usually limited to 1 or 2 hours, whereas the current
threshold is usually set at a value set to a C-rate of C/100.
 |
|
|
|
|
Charge/discharge cycling can be time consuming, depending on the number of cycles
required to observe significant capacity fade/degradation. When performing failure
analysis, often a few charge/discharge cycles are the minimum required to establish
stability in the capacity measurement and identify the degradation rate.
-
Different batteries have different rate capabilities. Batteries that are not optimized for
high discharge currents will not be able to deliver as much capacity at a rate of 2C or
higher, whereas high power lithium-ion batteries may be able to supply sufficient
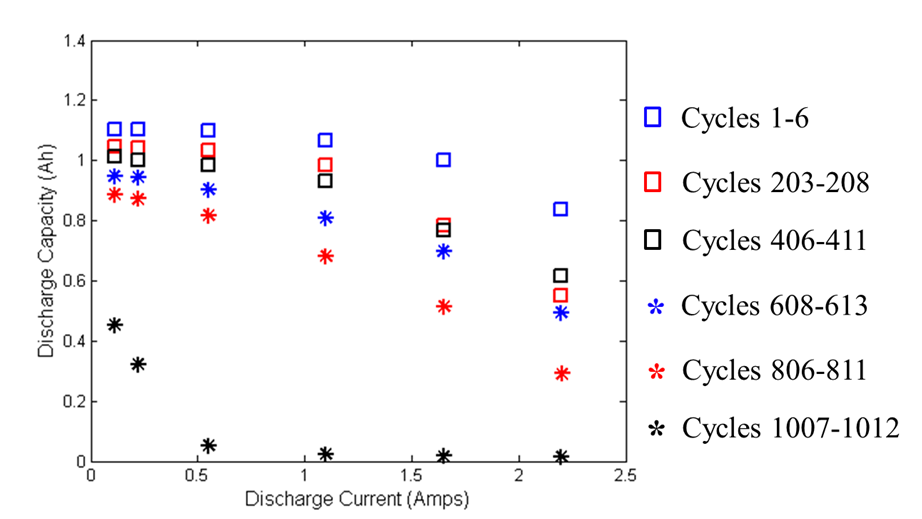
capacity at higher rates. The figure below shows a 1.1 Amp-hour lithium-ion prismatic
cells rate capability at different discharge rates. At rates above 1C (1.1 Amp), the battery
discharges significantly less capacity. This difference increases as the battery ages.
Eventually, the battery ages to a point at which negligible capacity can be discharged
from the battery at any rate. This can be seen in the below figure where the shape of the
curve changes drastically from cycles 806-811 to cycles 1007-1012.
 |
|
|
|
|
Cells that have excessive moisture introduced into the electrolyte during the assembly
process can exhibit a much more drastic rate-capability effect. Discharge at low rates
(< C/10) will provide the full discharge capacity of the battery, however, even moderate
discharge rates (C/2) will result in minimal capacity delivery. This is due to the high
electrolyte resistance which causes a large voltage drop when a current is applied to the
battery. Ultimately, the battery reaches its lower voltage limit in a shorter time frame,
resulting in a reduced available capacity.
-
Electrochemical impedance spectroscopy (EIS) can be used to assess the health of a
battery. When an AC voltage or current signal is injected into a battery, the
corresponding current or voltage response of the battery can be used to calculate the
complex impedance of the battery. For a given frequency AC signal, the battery will
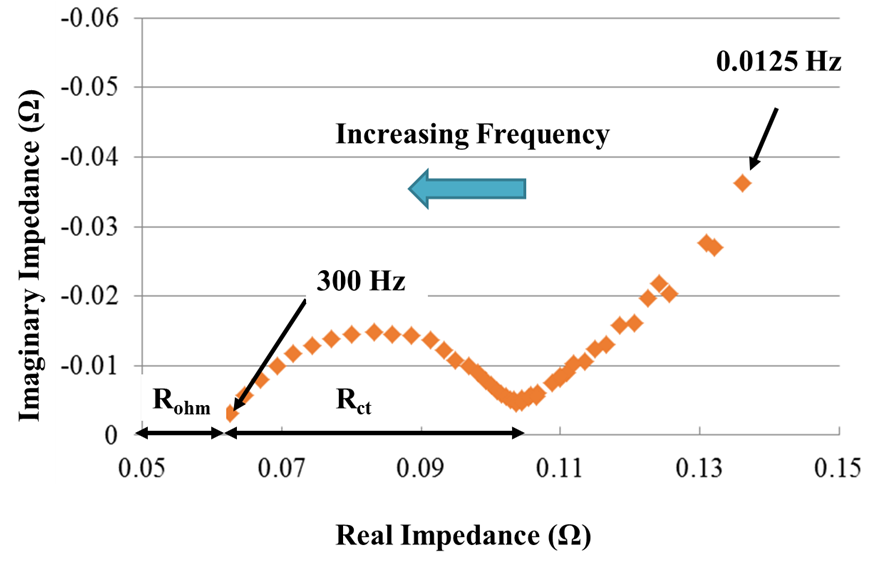
exhibit both a real and imaginary impedance response. This can be visualized using a
Nyquist plot seen in the figure below. The real impedance is graphed on the horizontal
axis and the imaginary impedance is graphed on the vertical axis. The offset of the curve
from the vertical axis is labeled Rohm, or the ohmic resistance. The ohmic resistance
accounts for the resistance of electron flow due to the cell components including the
current collectors, electrodes, and electrolyte. The width of the semi-circle represents the
charge transfer resistance, Rct. The charge transfer resistance accounts for the resistance
to charge transfer processes at the surface of the electrode particles. This is due to the
solid electrolyte interphase (SEI) layer inhibiting charge transfer.
 |
|
|
|
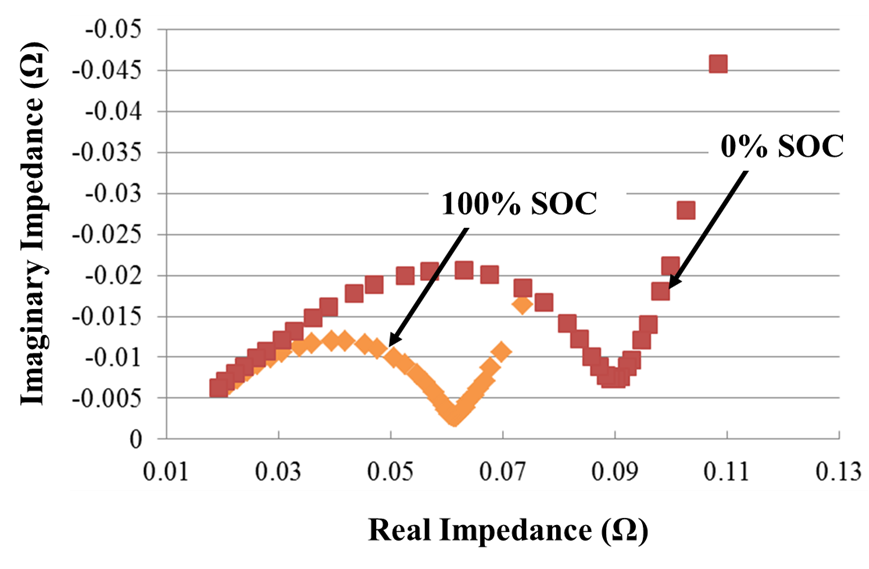
The size of the semi-circle (width and height) changes as a function of both state of
charge (SOC) and state of health (SOH). The figure below illustrates the difference in the
Nyquist plot for a fully discharge (0% SOC) and fully charged (100% SOC) battery. The
ohmic resistance does not change significantly; however, there is a significant growth in
charge transfer resistance as the battery becomes fully discharged.
Changes to the impedance spectra are also a result of battery aging. As the SEI layer
grows throughout the batterys life, the charge transfer resistance increases. Loss of
connectivity between electrode particles and degradation of the current collector could
also lead to changes in the ohmic resistance.
-
DC internal resistance tests measure the ohmic resistance of the cell by applying one or
more current pulses. The resistance is calculated using Ohms law:
R=?V/?I
Where R is the resistance, ?V is the change in voltage from the beginning of the pulse to
the end of the pulse, and ?I is the change in current during the pulse. Because a lithium-
ion battery is a complex electrochemical device, the pulse needs to be short in duration
(<10 ms) to capture the purely ohmic effect of the current pulse. In some tests, several
pulses are applied sequentially and averaged to provide a measure of the internal
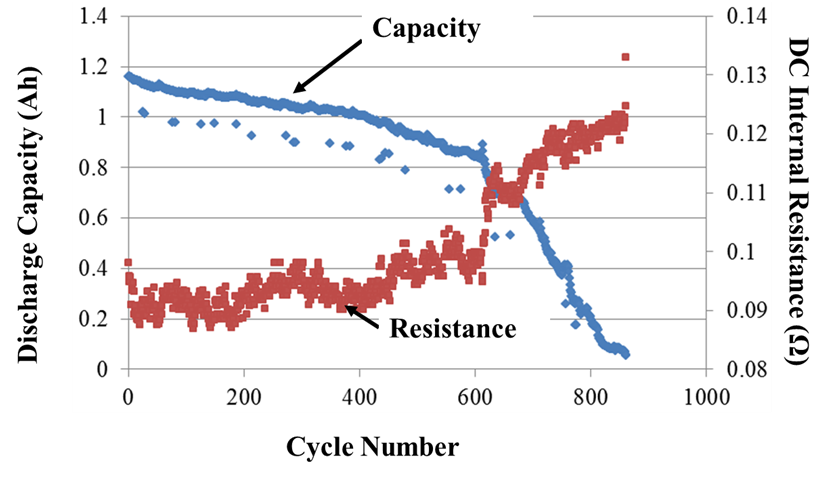
resistance. As a cell ages, the ohmic resistance increases due to degradation in the cell
components. The increase in resistance as the battery ages (decreases in deliverable
discharge capacity) can be seen in the below figure. Resistance measurements can be
noisy; however, they are more easily obtained than a full discharge capacity.
-
The open circuit voltage (OCV) of the battery is the cell potential when no load is
applied. It is not possible to measure the voltage of the cell without actually applying a
small load, therefore, the OCV has to be estimated. The OCV curve is an electrochemical
property of the electrode materials and represents the potential difference between the
anode and cathode when varying amounts of lithium are intercalated into their structures.
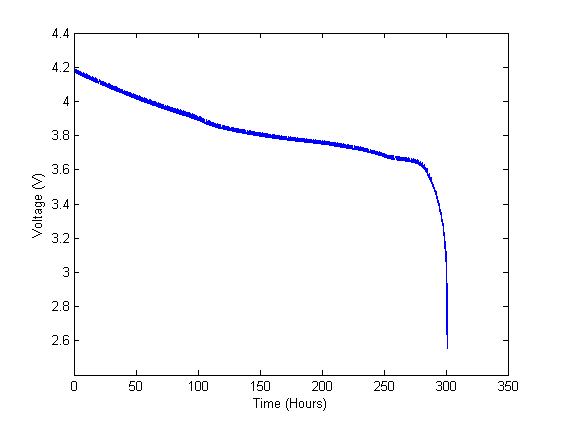
The OCV establishes a relationship between the voltage of the cell and the state of charge
by applying a slow charge/discharge (< C/25) profile and averaging the two curves
together or by discharging the battery using short (~ 1 minute) pulses followed by long
(~30 minute) rest periods. The pulse process produces a curve seen in the figure below.
The effect of the pulses can be seen more clearly on a zoomed-in image seen below.
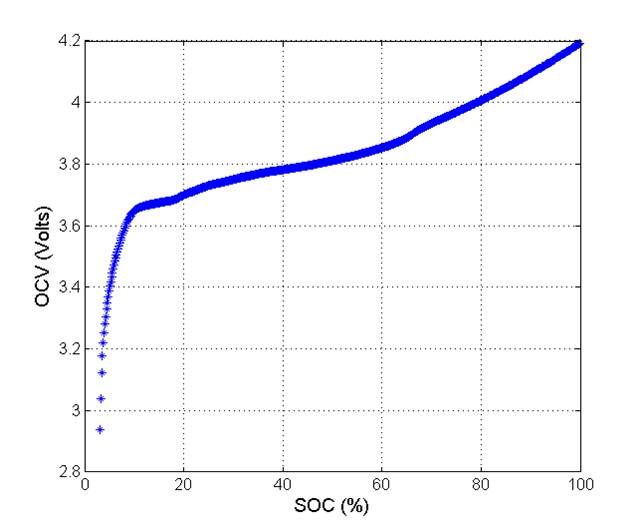
By capturing the trend in voltage at the end of the rest period and plotting versus state of
charge (SOC), a curve can be obtained relating OCV directly to SOC as seen below. The
OCV vs. SOC relationship is often used in producing a SO C estimation model which can
incorporate the effect of internal resistance on the overall battery voltage when it is under
load.
-
Cyclic voltammetry (CV) applies a linear voltage sweep to the cell and measures the
current response. Peaks in the CV curve correspond to reduction potentials at the cathode
during charging, whereas they correspond to reduction potentials at the anode during
discharge. This can be seen in the figure below.
When the battery ages, the peaks reduce in magnitude, indicating that there has been a
loss of active material and useable lithium ions. The reduction in peak magnitude can be
seen in the following figure.
Non-destructive structural testing
-
Ultrasonic transduction techniques are used in a variety of applications to detect changes
in impedance to an acoustic signal. The internal structure of a lithium-ion battery is made
up of layers of electrode and separator, and each layer serves as an interface for an
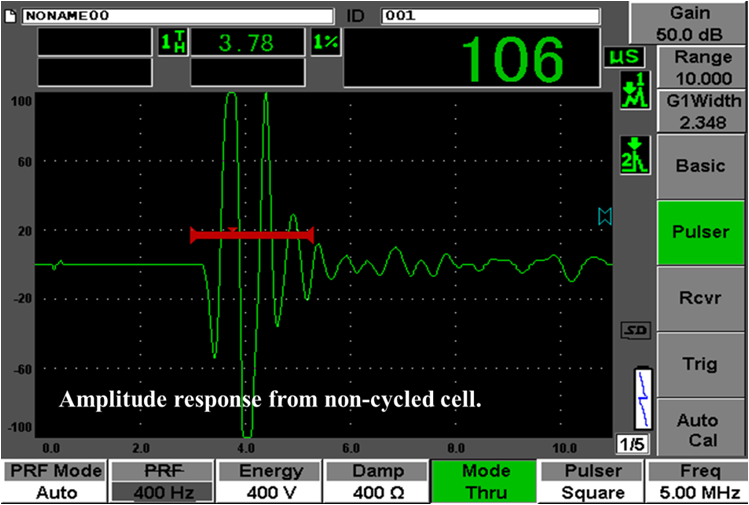
acoustic signal. In a pulse-echo mode, the reflected portion of the acoustic signal is
measured by the same transducer that produces the ultrasonic signal. In pitch-catch mode
(or through transmission), a second transducer measures the signal that travels through
the entire battery. The figure below shows the measured acoustic signal for an uncycled, healthy cell.
 |
|
|
|
If a cell has undergone abusive operating conditions such as overcharge, short circuit, or
thermal exposure, gas can generate within the cell. Gas pockets can cause bulging and
buckling of the electrodes and increase the thickness of the cell. When an ultrasonic
signal is sent through a degraded cell, there is a greater acoustic impedance, causing the
amplitude of the signal to reduce and the time of flight to reduce. This can be seen in the following figure.
-
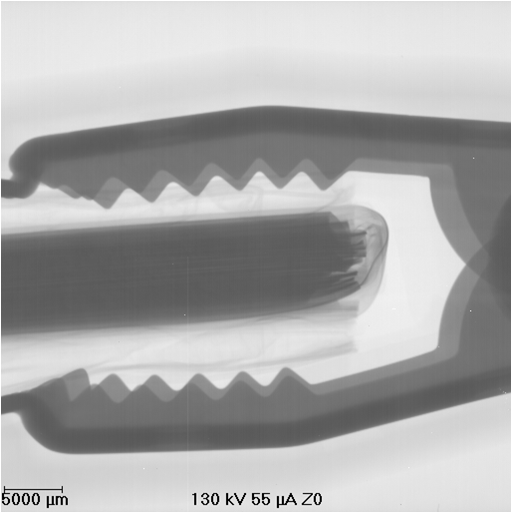
X-Ray imaging can be used to examine the internal structure of the cell for defects or
degradation. A new cell typically has a compact electrode winding structure as seen in
the figure below. No gaps can be seen in between the electrodes, and the electrodes do
not appear wavy.
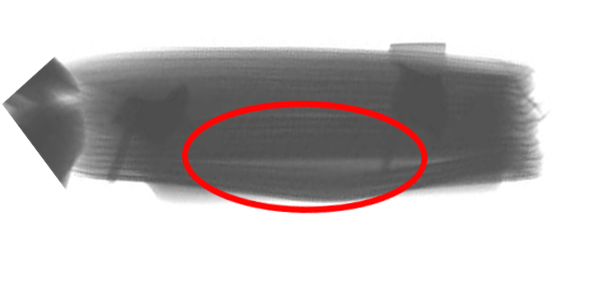
Over time, through thermally-induced stress concentrations and gas generation, the
electrodes can buckle. This can be seen in the figure below where the gap between
electrodes is highlighted.
-
Changes to the batterys structure can be detected through measurements of the batterys
thickness or the strain on the casing material. Changes to the thickness occur regularly as
a result of lithium-ion intercalation; however, this is a reversible effect (the cell increases
in thickness when it is charged, and decreases in thickness when it is discharged).
Permanent structural changes due to either gas generation or electrode buckling can also
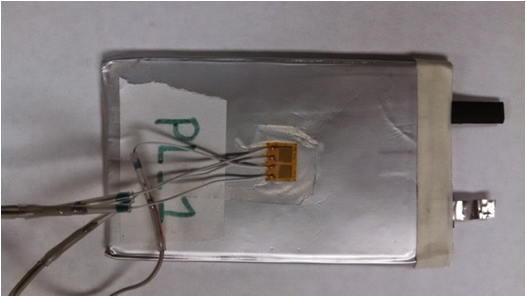
be detected and can be used as a health indicator. A strain gauge is a type of sensor that
can be used to measure the real-time changes to the structure of a lithium-ion battery. The
strain gauge can be adhered to the battery casing as seen below and used to measure
deformations in the cell due to transient or permanent changes to the structure.
Destructive analysis and testing
Cell disassembly is sometimes required to investigate changes in the batterys electrodes
and to identify failure mechanisms. Once the cell is open, further electrical or structural tests are
difficult to perform, and therefore, destructive testing is usually the last testing undertaken. Care
must be taken during the disassembly process to avoid short-circuiting the battery or altering the
properties of the electrodes. Often, disassembly within an argon-filled glove box is required to
prevent the cell components from reacting with moisture in the air. Once the cell is
disassembled, the electrodes are unwound and investigated. Important factors to look for are
burn marks or melting of the separator which could indicate an internal short circuit or excessive
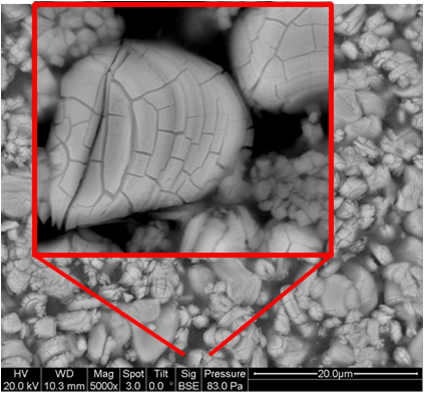
current draw. The electrodes can be further inspected using a scanning electron microscope to
identify cracking of the electrode particles as seen below.
|